Services


Cost Control : Turning Numbers into Profit Protection
By Soham Sawant - Consultant at Data-phi.ai
Introduction
In any business, cost control is not just a financial exercise, it is a strategic function that directly safeguards profitability. Whether in manufacturing, services, or construction, the role of cost control is to ensure that expenses stay within approved limits, identify early warning signs of financial risks, and enable timely corrective actions. Imagine a company launching a new product line. The initial budget is set, but as production begins, unexpected challenges arise: supplier prices increase, design changes are requested, or delays occur. Without a robust cost control process, these challenges can quickly erode margins and threaten the projects success. This blog explores how cost control works in practice, using a realistic, end-to-end example to illustrate its impact. We will also highlight the key KPIs that management relies on to control costs, recover value, and maximize profitability.
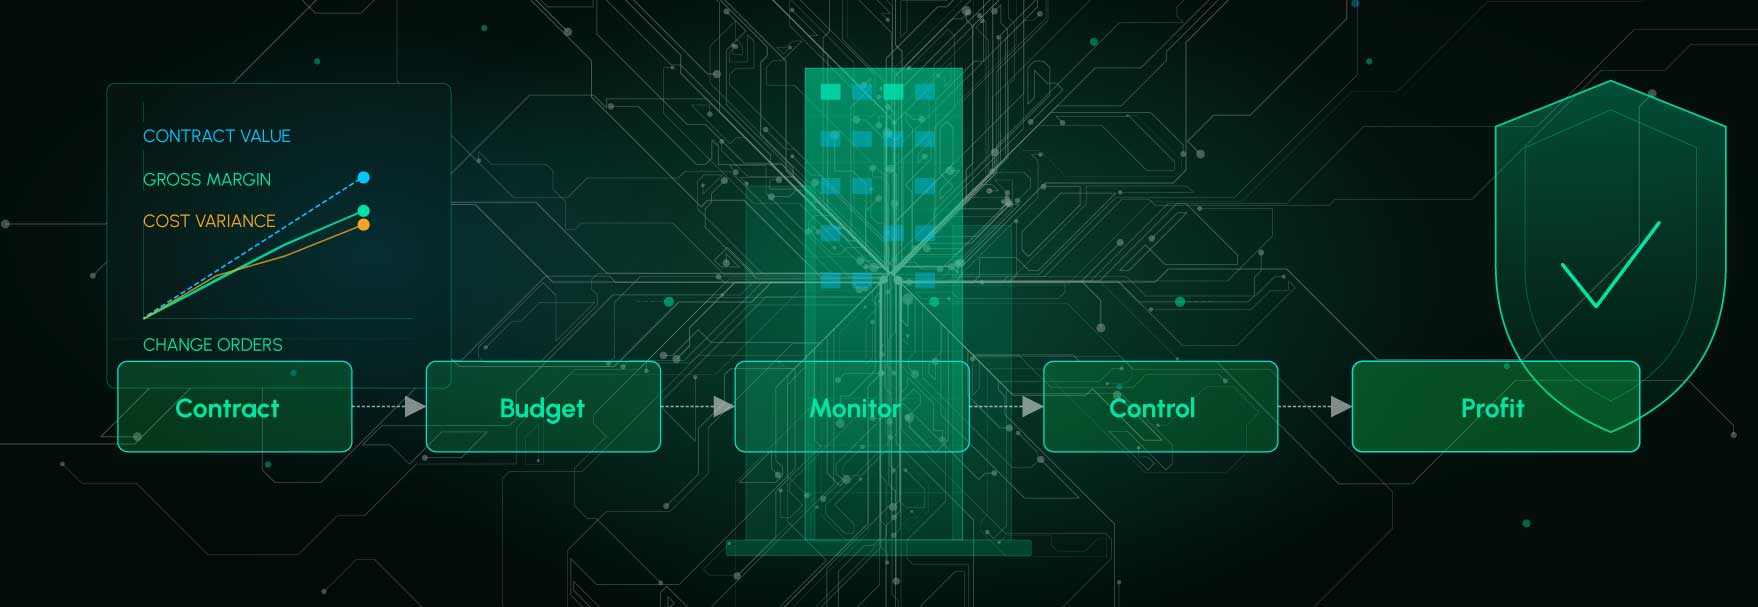
End-to-End Cost Control Flow
graph LR
    A[Contract Award] --> B[Budget Baseline]
    B --> C[Execution]
    C --> D[Monitoring]
    D --> E[Control Actions]
    E --> F[Profit Realization]

    classDef g1 fill:#0bdb5c,stroke:#04e3cc,color:#000000,stroke-width:2px,rx:12,ry:12;
    classDef g2 fill:#0ecf6a,stroke:#04e3cc,color:#000000,stroke-width:2px,rx:12,ry:12;
    classDef g3 fill:#12c379,stroke:#04e3cc,color:#000000,stroke-width:2px,rx:12,ry:12;

    class A,F g1;
    class B,E g2;
    class C,D g3;

    linkStyle default stroke:#ffffff,stroke-width:2px,stroke-dasharray:4 4;
Cost Control in the Construction Industry
While cost control is essential across industries, its application in construction is particularly critical due to the sector’s complexity, long project timelines, and exposure to external risks.
The Example Company and Project
- Company Name: Apex BuildCon LLC
- Project: Azure Heights Residential Tower
- Location: Dubai
- Client: Private Real Estate Developer
Contract Overview
- Contract Value: AED 120 million
- Initial Approved Budget: AED 100 million
- Expected Gross Margin: AED 20 million (16.7%)
- Planned Project Duration: 24 months
At the start of the project, the cost control team creates a baseline budget by breaking the AED 100 million into detailed cost heads:
- Concrete & Civil Works
- Steel & Structural Components
- MEP (Mechanical, Electrical, Plumbing)
- Finishing & Interiors
- Subcontractor Costs
- Overheads & Site Expenses
- Contingency Reserve
This baseline becomes the reference point for all future comparisons.
1. Budget vs Actual: Managing Cost Variations
Steel Price Volatility A Real-World Challenge
Six months into the project, global steel prices fluctuate sharply. During planning, Apex BuildCon estimated steel at AED 2,800 per ton, but actual procurement happens at AED 3,200 per ton.
This creates a negative cost variance.
- Estimated Steel Cost: AED 18 million
- Actual Steel Cost (Forecast): AED 21 million
- Variance: AED 3 million
The cost control team analyzes the variance across multiple dimensions:
- Product level: Specific steel grades causing overruns
- Site level: Wastage or rework issues
- Supplier level: Contract terms and price escalation clauses
- Project level: Overall margin impact
- Legal Entity level: Consolidated financial exposure
Recovery Actions
To mitigate the impact, the business explores:
- Value engineering alternatives
- Supplier renegotiations
- Design optimizations
- Re-forecasting remaining quantities at revised rates
2. Change Orders: Protecting the Contract Value
Client-Requested Changes
Midway through construction, the client requests:
- Addition of one extra floor
- Additional internal partitions in residential units
After commercial evaluation:
- Additional Contract Value Approved: AED 15 million
- Revised Contract Value: AED 135 million
- Associated Incremental Cost: AED 11 million
- Net Positive Impact: +AED 4 million
Why Change Management Matters
Without proper cost control:
- Changes may be executed without formal approval
- Costs may be incurred but never billed
- Margins silently erode
3. Timeline Adherence and Liquidated Damages
Delay Risk
The Azure Heights project has a contractual clause:
Liquidated Damages (LD): AED 75,000 per day of delay
Due to material delivery delays and design revisions, the project risks slipping by 20 days.
Potential LD Exposure: AED 1.5 million
Cost Control Perspective
The cost control team tracks:
- Planned vs actual progress
- Days ahead / behind schedule
- Financial impact of delays
4. Contingency Management
Planned Risk Buffer
At project inception, Apex BuildCon allocates:
- Contingency Reserve: AED 5 million
During execution:
- AED 1.2 million used for unforeseen soil conditions
- AED 0.8 million used for temporary access redesign
5. Accruals and Billing Discipline
Work Done but Not Yet Billed
In large projects, work is often completed before invoices are raised.
Example:
- Electrical works completed in March
- Vendor invoice expected in April
- Client billing cycle is monthly
The cost control team records:
- Accrued Costs: AED 2.5 million
6. Executive Performance Questions That Define Project Success
Instead of just tracking numbers, leadership focuses on critical business questions that determine whether the project delivered to the client is financially healthy and commercially secure.
How accurate is our forecasted margin at project completion?
This measures how confidently we can predict the final profit after considering revised contract values, approved and submitted changes, and all expected costs including potential overruns. In simple terms, it answers: If the project closed today based on current visibility, how much profit would we actually retain?
Which projects are strong performers and which are budget deteriorators?
This evaluates how much cost deviation is expected at completion due to approved and submitted changes. Projects with cost changes close to zero indicate strong control, while larger variances signal margin pressure and weaker financial discipline.
How defensible is our recognized revenue?
This checks whether the revenue recognized truly reflects the physical and financial progress of the project. It compares completion progress against revised contract value to ensure we are neither over-recognizing revenue nor leaving money unclaimed.
Are we positioned for recovery or exposed to financial risk?
This compares submitted claims against expected liquidated damages (LDs) exposure. If LD risk exists, it shows whether claims are sufficient to offset penalties; if no LD risk exists, it highlights additional claim opportunities that can improve profitability.
Is our actual progress aligned with certified progress?
This compares internal project completion (based on cost incurred versus expected total cost) with client-certified invoices. A mismatch may indicate delayed billing, aggressive revenue recognition, or cash flow inefficiencies.
7. Conceptual Frameworks
Budget vs Actual vs Forecast (EAC) Triangle
graph LR
    A[Budget] --> B[Actual Cost]
    A --> C[Estimate at Completion]

    B --> D[Difference]
    C --> D

    D --> E[Cost Variance]
    E --> F[Impacts]
    F --> G[Profitability]

    classDef g1 fill:#0bdb5c,stroke:#04e3cc,color:#000000,stroke-width:2px,rx:12,ry:12;
    classDef g2 fill:#0ecf6a,stroke:#04e3cc,color:#000000,stroke-width:2px,rx:12,ry:12;
    classDef g3 fill:#12c379,stroke:#04e3cc,color:#000000,stroke-width:2px,rx:12,ry:12;
    classDef subtle fill:#18b07f,stroke:#04e3cc,color:#000000,stroke-width:2px,rx:12,ry:12;
    class D,F subtle;

    class A,G g1;
    class B,E g2;
    class C,D,F g3;


    linkStyle default stroke:#ffffff,stroke-width:2px,stroke-dasharray:4 4;
Change Management Flow
graph LR
    A[Client Request] --> B[Technical Evaluation]
    B --> C[Commercial Impact]
    C --> D[Approval]
    D --> E[Execution]
    E --> F[Billing]

    classDef g1 fill:#0bdb5c,stroke:#04e3cc,color:#000000,stroke-width:2px,rx:12,ry:12;
    classDef g2 fill:#0ecf6a,stroke:#04e3cc,color:#000000,stroke-width:2px,rx:12,ry:12;
    classDef g3 fill:#12c379,stroke:#04e3cc,color:#000000,stroke-width:2px,rx:12,ry:12;

    class A,F g1;
    class B,E g2;
    class C,D g3;

    linkStyle default stroke:#ffffff,stroke-width:2px,stroke-dasharray:4 4;
8. Earned Value Management (EVM): Linking Cost, Time, and Progress
Core Earned Value Concepts
- Planned Value (PV): Budgeted cost of work that should have been completed by a given date.
- Earned Value (EV): Budgeted value of work that has actually been completed.
- Actual Cost (AC): Real cost incurred for the work performed.
Example from Azure Heights
At Month 10:
- Planned construction progress: 45%
- Actual construction progress achieved: 40%
- Total Budget (BAC): AED 100 million
- Planned Value (PV): AED 45 million
- Earned Value (EV): AED 40 million
- Actual Cost (AC): AED 43 million
9. AI and Advanced Analytics Use Cases in Cost Control
RAG-Based Cost Intelligence
Using Retrieval-Augmented Generation (RAG), cost engineers and project managers can query project data, contracts, historical job performance, and cost reports using natural language. The system retrieves relevant project records and generates contextual insights to explain cost variances, change orders, and financial risks in real time.
Predictive Cost Overrun Detection
Machine learning models can analyze historical project data such as budget revisions, cost consumption patterns, procurement delays, and productivity metrics to predict potential cost overruns early. This allows project teams to proactively intervene before the variance impacts project margins.
Cost Risk Ranking and Forecasting (ML-Based Risk Scoring)
A predictive analytics approach can be used to identify which products or cost categories may pose higher financial risk during project execution. By analyzing patterns such as the frequency of cost variances across projects, the magnitude of budget deviations, and projected cost differences at completion, these factors can be synthesized into a risk indicator. This indicator helps highlight cost areas that may require closer monitoring due to their potential impact on overall project profitability.
Executive Copilot for Cost Control
An AI copilot can assist executives and project leaders by summarizing project financial health, highlighting risks, and recommending actions. Powered by DataPhi’s multi-orchestrator framework, the copilot can coordinate multiple AI agents across enterprise data sources while maintaining governance, security, and contextual understanding of project performance.
Final Thought
In construction, profitability is rarely lost in one big decision, it erodes through hundreds of small, unmanaged ones. A mature cost control framework, enhanced with analytics and AI, ensures those decisions are visible, actionable, and aligned with business outcomes.
If you’re looking to modernize cost control with advanced analytics and AI, contact us to explore how DataPhi can support your transformation.
Other Blog

See How Data and AI Can Deliver Results Quickly for Your Business
Please fill out the form, and our team will get in touch with you!