
Services


The Hidden Profit Story: Turning SKU-Level Data into Business Action
By Sridevi Pydi

Profitability is often reviewed through final numbers — revenue, gross profit, EBITDA, and net profit. These measures are important, but they usually tell only the outcome.
The real profitability story is often hidden much deeper.
It sits inside products, customers, channels, geographies, discounts, trade spend, material costs, packaging costs, overheads, and finance adjustments. For businesses managing large SKU portfolios, this level of visibility is essential because a profitable business at a summary level may still have margin pressure hidden at SKU level.
This is where SKU-level profitability analytics can create real business value. It helps organizations move beyond static reporting and understand where profit is created, where it is reduced, and where business action is required.
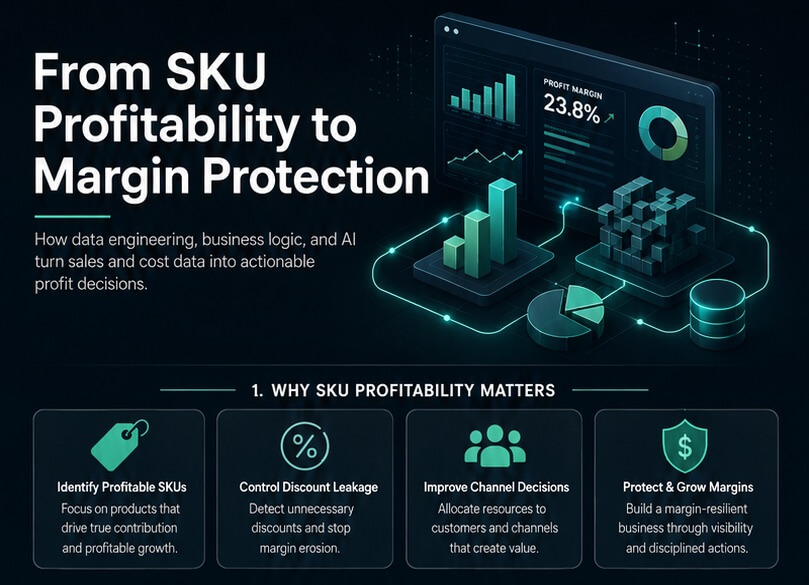
Why SKU-Level Profitability Matters
A product with high sales may not always be a profitable product.
A customer with strong revenue may not always be a high-value customer.
A channel with good volume may not always be contributing healthy margin.
This is because profitability is not driven by sales alone. It is shaped by pricing, discounts, cost of goods, supply chain expenses, customer terms, channel mix, geography-level costs, and operating expenses.
Without SKU-level visibility, these factors may remain hidden inside consolidated reports. Business teams may know that profitability has changed, but they may not clearly understand what caused the change.
SKU profitability helps answer practical business questions such as:
- Which SKUs are truly contributing to profit?
- Which products are creating margin pressure?
- Which customers or channels are diluting profitability?
- Where are discounts and trade spend reducing net revenue?
- Which cost components are increasing?
- Which areas require pricing, cost, or portfolio review?
This shifts profitability analysis from simple reporting to better business understanding.
From Final Numbers to Profit Drivers
Traditional financial reports usually answer:
What happened?
SKU-level profitability analytics helps answer:
Why did it happen, where did it happen, and what should be reviewed?
This difference is important.
For example, if EBITDA has reduced, the reason may not be visible from the final number alone. The root cause could be higher discounts, increased raw material cost, packaging cost pressure, higher selling and distribution expenses, low-margin customers, or a change in product mix.
When the complete profitability flow is available at SKU, customer, channel, and geography level, business teams can identify the exact drivers behind the movement.
The profitability journey becomes clearer when each financial layer is viewed step by step.
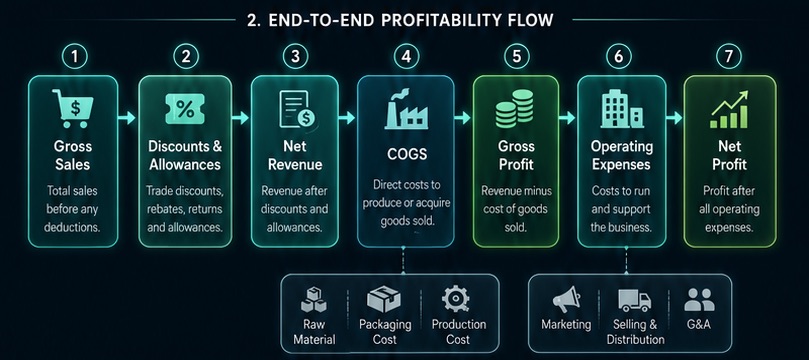
A strong profitability view connects the complete journey:
Gross Sales → Discounts & Allowances → Net Revenue → COGS → Gross Profit → Operating Expenses → EBITDA → Net Profit
Each stage explains how value is created, reduced, or protected.
Gross Sales shows the top-line value before deductions.
Discounts and allowances show the commercial impact of rebates, returns, trade spend, and other deductions.
Net Revenue shows the real revenue after commercial deductions.
COGS explains the direct cost of producing or acquiring the product, including raw material, packaging, and production-related costs.
Gross Profit shows the value left after product cost.
Operating expenses show the cost of running and supporting the business, including marketing, selling and distribution, and G&A.
EBITDA and Net Profit show the final profitability after business and finance impacts.
When this flow is analyzed only at a high level, many issues stay hidden. When it is analyzed at SKU level, it becomes a decision-making tool.
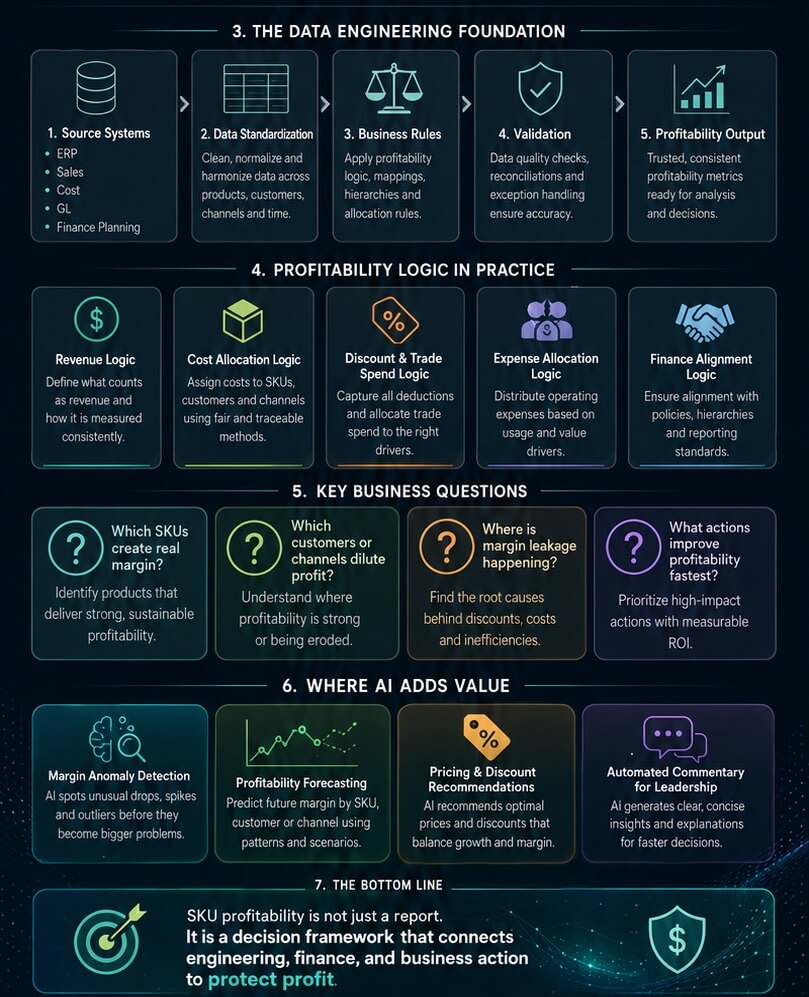
The Data Engineering Foundation
SKU profitability is not only a finance calculation. It requires a strong data foundation.
The required data often comes from multiple systems — ERP, sales, cost, general ledger, finance planning, product masters, customer masters, and adjustment files. Each source may have different formats, definitions, hierarchies, and business rules.
Data engineering plays a critical role in bringing these sources together into one trusted model.
This includes:
- Standardizing product, customer, channel, and geography data
- Applying profitability rules consistently
- Allocating costs to the correct SKU, customer, or channel
- Validating source data and output numbers
- Reconciling system values with finance reporting
- Creating trusted datasets for dashboards and analysis
Without this foundation, profitability reporting can become manual, inconsistent, and difficult to explain.
With a governed data model, business users can work from one version of truth.
Turning Profitability Data into Action
The real value of SKU profitability is not only in calculating numbers. The value comes from converting those numbers into action.
For example, profitability analytics can highlight:
- Loss-making SKUs
- SKUs with declining gross margin
- High-discount products
- Customers with low contribution
- Channels with high cost-to-serve
- Categories where cost is increasing faster than revenue
- Geographies where EBITDA is under pressure
- Gaps between system-calculated values and finance-adjusted values
These insights help different teams make better decisions.
Finance teams can use them for monthly profitability review, reconciliation, and variance explanation.
Sales teams can use them to understand customer profitability, discount impact, and pricing decisions.
Supply Chain and Operations teams can use them to review material cost, packaging cost, and overhead pressure.
Leadership can use them to identify where profit is being created, protected, or lost.
This is how SKU profitability moves from reporting to business action.
Where AI Can Add Value
AI should not be seen as a replacement for finance logic or business rules. The core profitability calculations must still be driven by structured data, governed logic, and validated financial rules.
However, AI can act as an assisted intelligence layer on top of the profitability model.
It can help business users understand profitability faster by supporting explanation, exception identification, and guided analysis.
Variance explanation
AI can summarize why profitability changed by analyzing movements across revenue, discounts, costs, and expenses.
Anomaly detection
AI can identify unusual changes such as abnormal discounts, sudden cost increases, unexpected margin drops, or unusual adjustment impacts.
Margin risk identification
SKUs can be classified based on profitability health, helping teams focus on products that need attention.
Natural-language analysis
Business users can ask questions such as “Which SKUs are causing profit leakage?” or “Why did EBITDA reduce this month?” and receive guided explanations.
Leadership commentary
AI can support concise business commentary for monthly reviews by summarizing the key drivers behind profitability movement.
The goal is not just to show more dashboards. The goal is to make profitability insights easier to understand and faster to act on.
Once the foundation is built, analytics and AI can convert profitability data into decisions.
Business Impact
SKU-level profitability analytics can create value across the organization.
It improves transparency by showing how sales, costs, discounts, and expenses impact final profitability. It reduces manual effort by creating a consistent profitability model. It improves decision-making by helping teams identify the root causes behind margin movement.
Most importantly, it helps organizations act earlier.
Instead of waiting until profit pressure appears in consolidated financial results, teams can identify warning signs at SKU, customer, channel, or geography level.
This enables better pricing decisions, stronger cost control, improved product mix, more effective discount governance, and better alignment between Finance, Sales, Supply Chain, and Leadership.
Conclusion
Profitability analysis should not stop at final numbers.
The numbers tell us what happened, but SKU-level analytics helps explain why it happened and where action is needed.
By connecting sales, cost, finance, and operational data, organizations can uncover the hidden profit story behind every SKU. With the right data engineering foundation, business logic, analytics, and AI-assisted insights, profitability reporting can evolve into a practical decision framework.
The future of profitability analytics is not only about measuring profit.
It is about understanding the drivers behind profit — and taking timely action to protect and grow it.
Other Blog

See How Data and AI Can Deliver Results Quickly for Your Business
Please fill out the form, and our team will get in touch with you!